Power BI
Power BI is a set of analytical tools that give you a real-time view of your business and can be accessed from all types of devices.
 Thanks to the Power BI tool, your company data is transformed into a clear visual form, which contributes to their correct understanding, including their context. At the same time, you have the opportunity to monitor data development trends and thus better plan and make predictions.
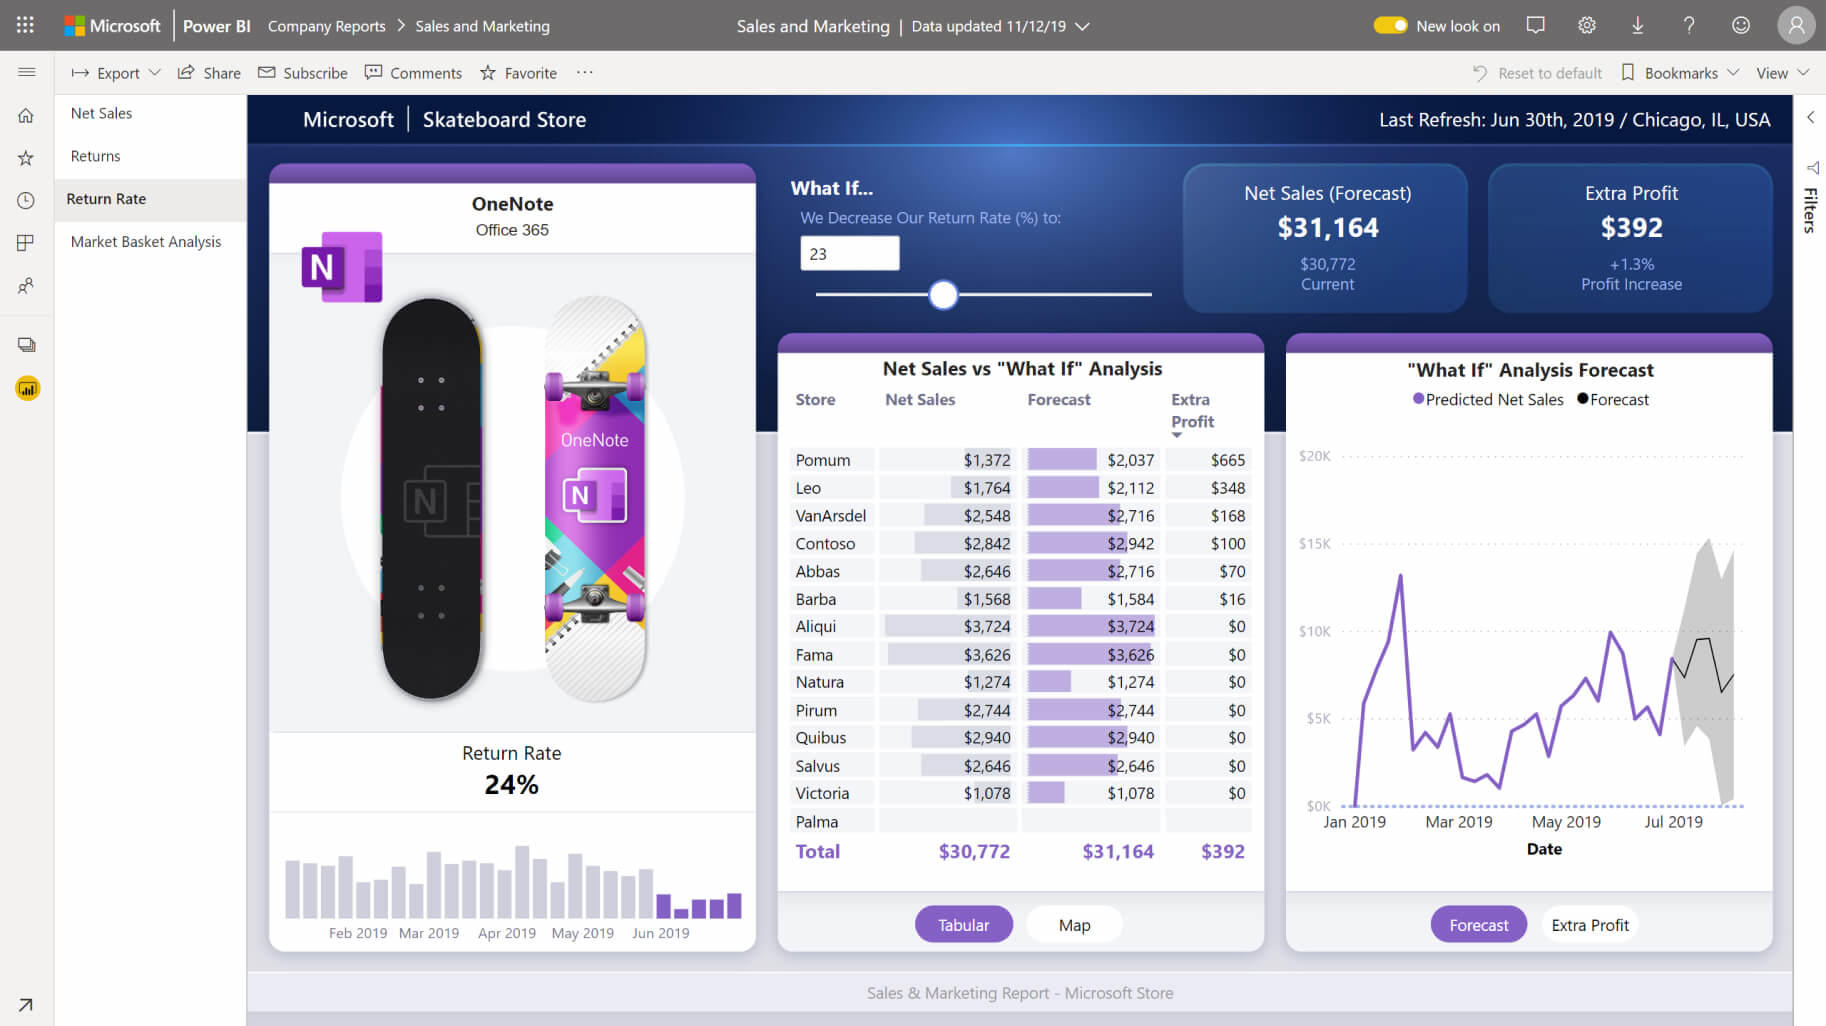
You can use Power BI connectors to connect data to various data sources. The tool transforms data from these sources into the required data model, from which reports and visual summaries can be created across various systems and databases. You can easily share the generated outputs with your colleagues.
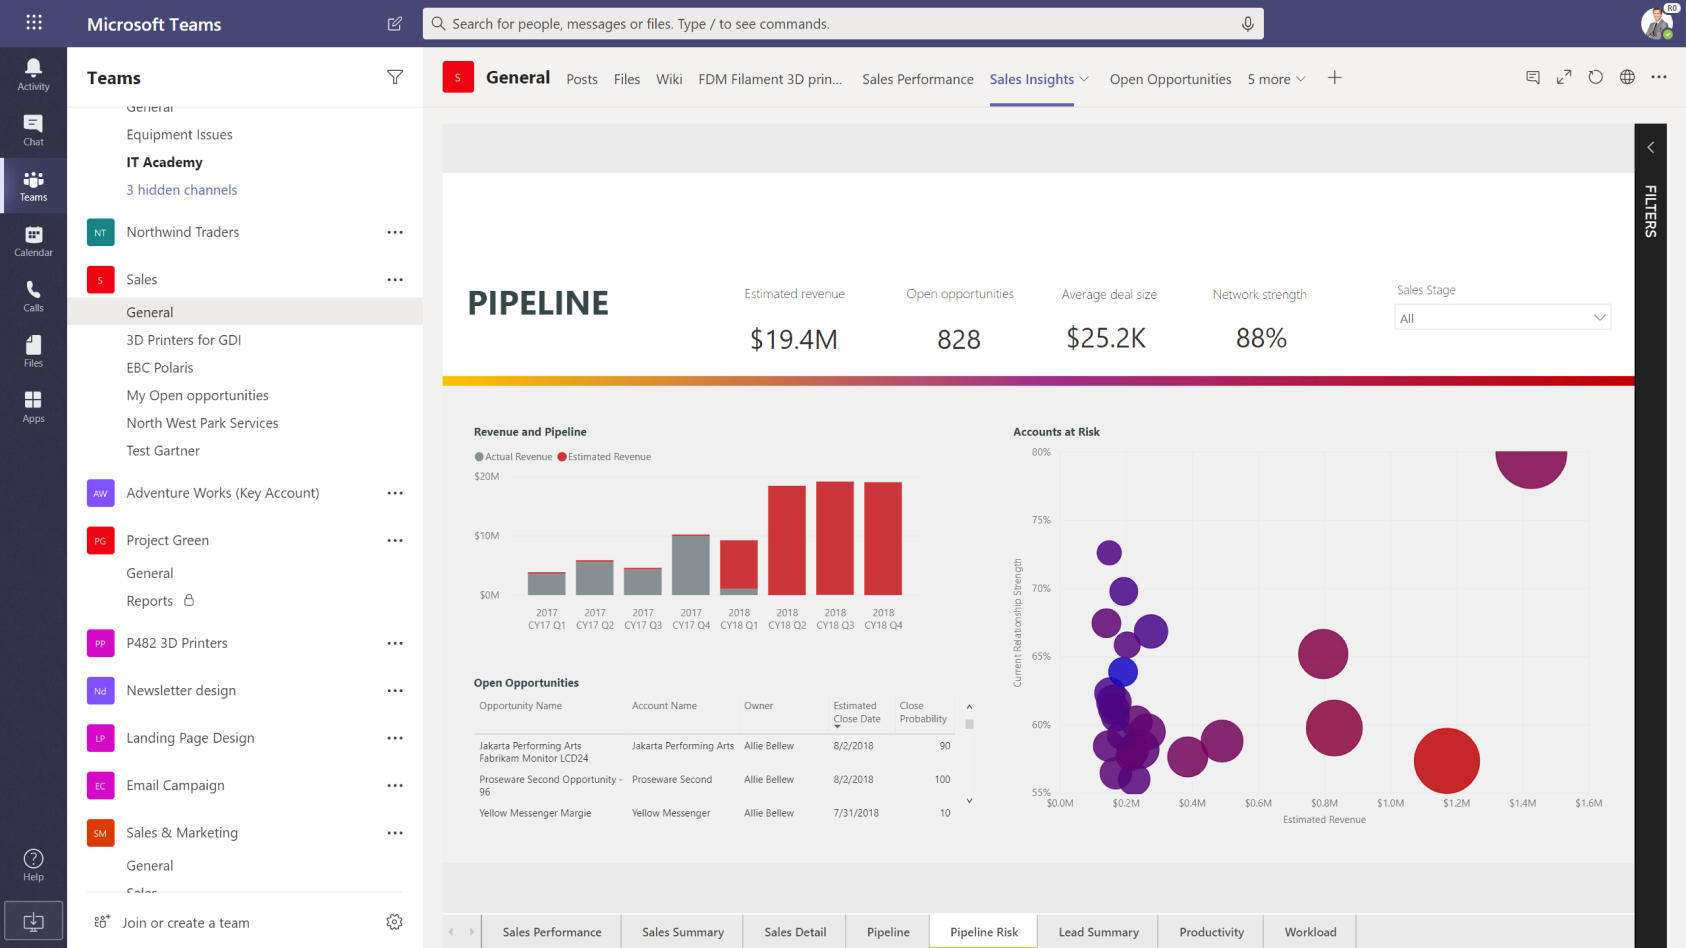
Reports created in Power BI are available from all devices and within Microsoft Dynamics 365 Business Central. Directly in the company's ERP system, you can have a quick overview of, for example, the number and status of open business cases, financial results, available resources, etc.
Power BI Desktop
Power BI Desktop is a free desktop application that allows you to connect to, transform, and visualize data. The creation of reports and visual outputs will be facilitated by a well-known environment Microsoft 365 (Office 365). Many functions are available here, such as fast measurements, grouping, forecasting or so-called clustering.
Power BI Pro
Use Power BI Pro to distribute and share generated reports. Users with allowed access to reports can further process the outputs. It is possible to filter the data using a combination of various criteria and break them down into exact values.
